 Skip Navigation

How is it possible to detect how often related people have kids together, worldwide?
November 20, 2012
- Related Topics:
- Population genetics,
- Intermarriage
A curious adult from California asks:
"I have seen numbers about how often closely related people in different parts of the world have kids together. How do they get those numbers? Do they just look through marriage records or is there some way to see it in their DNA?"
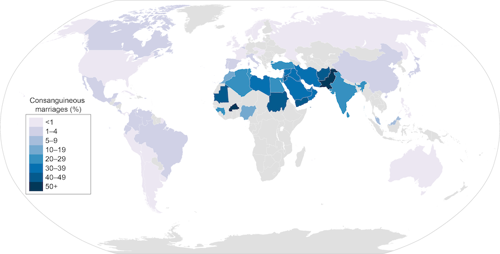
It is true that some parts of the world have more marriages between closer relatives than other parts of the world. For example, as you can see in the map below, it isn’t uncommon for first cousins to marry in Pakistan or Saudi Arabia but it is pretty rare in the U.S.
What is interesting is that we can pretty easily see this legacy in these people’s DNA. But explaining how to see it isn’t simple. Still, I’ll have a go at it.
Basically what scientists do is predict what a population’s DNA would look like if there was completely random mating. Jane has an equal chance of having kids with John, James or the other 150 million men in the U.S.
They then compare that result to what they see in a population. Any big difference means something was going on to affect the numbers. Some of these differences point to lots of relatives having kids together.
To understand this kind of difference, we need to remember that we each have two complete sets of DNA. One set comes from mom and one comes from dad. If the two sets look more alike to each other than they should, then there have been a lot of close relatives having kids together.
Scientists call this the heterozygote deficit. Heterozygote just means a difference between the two sets of DNA.
While this is easy to say, the tricky part is showing how they figure out if the two sets are more similar than they should be. To show you how scientists do this, let’s first take a step back and investigate what it would look like at a single gene.
Two Copies, Different Versions
Since we have two sets of DNA, this means we have two copies of most of our genes too. We get one copy from mom and one copy from dad.
These genes can come in different versions. So this means that people can have two of the same version of a gene or they can have two different versions. (Having two of the same versions is called homozygous and two different versions is heterozygous.)
Imagine that there is a gene that comes in two versions, A and a. The three possible combinations are:
- AA
- Aa
- aa
You can tell if a lot of related people in a population are having kids together if the number of Aa people is less that we’d predict (this is called a heterozygote deficit). Why is this? Well, it has to do with how genes are passed down.
When we have kids, we pass only one copy of each of our genes to them. The other parent passes one copy too so the child ends up with the usual two copies of each gene.
So an Aa parent can pass either an A or an a down to their child. Since which one gets passed is random, each child has a 50% chance of getting an A and a 50% chance of getting an a.
When closely related people have kids, they are more likely to share a lot of the same gene versions. This means they are more likely to pass down the same gene versions to their kids too.
The end result is that in this population, you’ll have more people with the same two copies than you will of people who have different copies. In our case, this means more AA and aa people and fewer Aa people.
OK, as I said before, we now get to the tricky part. We need to be able to figure out what we would expect for a group of people where relatives aren’t having kids together. Then we can compare it to what we see in a test population. If there are too few Aa’s, then one explanation for this deficit is that there were a lot of cases of close relatives having kids.
Before going on I want to note that so far we have been dealing with a single difference in a single gene—our gene that comes in A and a versions. In reality, we tend to deal more with thousands or even millions of differences spread out over the DNA for these types of studies.
This huge number of differences rules out an explanation where Aa people happen not to do as well. Imagine AA and aa people are healthy and Aa people die at birth. Even without any kissing cousins, there’s going to be a lot fewer Aa types around. Looking at lots of different places on the DNA helps to rule out these kinds of explanations.
Hardy Weinberg
The first thing we need to do is figure out the percentage of A’s and a’s that are in a population. The easiest way to show this is to go through an example.
Example 1
Imagine a population looks like this:
|
AA |
40 |
|
Aa |
320 |
|
aa |
640 |
So we have 40 AA people which means they contribute 80 A’s to the population. We also have 320 Aa people which adds another 320 A’s. In total, we have 400 A’s in this population.
We have 640 aa people which means 1280 a’s. Again we have 320 Aa people which adds another 320 a’s. We have a total of 1600 a’s.
Now we need to figure out the percentage of each. We have 400/2000 A’s or 20% A. We have 1600/2000 a’s or 80% a. To be able to use these numbers for the next step, we need to convert the percentages to decimals. So we have 0.2 A and 0.8 a.
We now need to plug these numbers into something called the Hardy Weinberg formula. This formula is:
p2 + 2pq +q2 = 1
In this equation, p represents the capital letter and q represents the lower case letter. So p is the same as A which is 0.2 and q is the same as a which is 0.8.
What we want to do is figure out 2pq. This tells us the percentage of people in this population who should be Aa. In this case it is:
2pq = 2(0.2)(0.8) = 0.32
Next we need to convert that to people. So we multiply the 0.32 by the total number in the population which in this case is 1000 people. So:
0.32(1000) = 320 Aa people.
This is the expected number of Aa’s if relatives aren’t having kids with each other. We now compare the Aa number to this one and find they are equal. Since they are equal, there is no inbreeding!
Whew, that was rough! Now let’s do another example.
Example 2
Let’s say a population has the following numbers:
|
AA |
375 |
|
Aa |
250 |
|
aa |
375 |
To keep things simple, we are again looking at a population of 1000. Now we go through the same procedure as we did before.
We have 750 A’s from the AA folks and 250 from the Aa folks for a total of 1000 A’s. We also have 750 a’s from the aa people and 250 from the Aa’s giving a total of 1000 a’s.
So for both cases we have 1000/2000 or 50%. This population is half A’s and half a’s which translates to a p of 0.5 and a q of 0.5. (Remember that p is the same as A and q is the same as a in our example here.)
Now we plug this p and q into 2pq like so:
2pq = 2(0.5)(0.5) = 0.5
Next we multiply this by our total population of 1000 and get 500.
So we would expect 500 Aa people given how many A’s and a’s there are in this population. Instead we have only 250. This means this population is not in Hardy Weinberg equilibrium.
There are a couple of reasons this might happen, but one possible explanation is that lots of relatives were having kids together.
Example 3: One for you to try!
As a final step, I’ll give you one to do. Here is the population:
|
AA |
563 |
|
Aa |
375 |
|
aa |
62 |
Remember, to figure this out:
- Figure out % A and %a in the population
- Convert % to a decimal
- Calculate 2pq -- which is the same as 2(A)(a)
- Multiply the answer from step 3 by the population number
- Compare this number to the number of Aa's in the original population
- If the two numbers are close to equal, then there was no inbreeding
So, were a lot of relatives having kids together? Scroll down to the end of this article to find out if you got the answer right.
Appendices
A formula to measure how inbred a population is
For anyone interested, you can get a feel for how inbred a population is with another formula. It is:
F = (% predicted 2pq – actual Heterozygote) ÷ % predicted 2pq
In this equation, F is the “coefficient of inbreeding”. This is a measure of how inbred a population is. If there is no inbreeding at all, it will equal 0. The closer it is to 1, the more inbreeding in the population.
Let’s look at this with numbers from Example 2 above:
- Our predicted 2pq was 0.5
- “Actual Heterozygote” just means the percent Aa. This was 250/1000, or 0.25
Plugging in the numbers we get:
F = (0.5 - 0.25) ÷ 0.5 = 0.5
This means there was a whole lot of inbreeding in this population.
The Amoeba Sisters’ take on Hardy Weinberg
Hardy Weinberg isn’t just used to detect inbreeding. Check out this fun video for more about how this equation is used.
The solution for Example 3
The answer to the question above is that the population does not have a lot of close relatives having kids together. Here is how to figure it out.
First we figure out the percent of A’s and a’s in the population:
- %A = (563 + 563 + 375)/2000 = 1501/2000 = 0.75
- %a = (62 + 62 + 375)/2000 = 499/2000 = 0.25
Where I got the numbers:
- There are 1000 total people. That means that there are 2000 total A’s + a’s.
- There are 563 AA people, who each have two A’s: 563 + 563
- There are 375 Aa people, who give 375 A’s and 375 a’s
- There are 62 aa people, who each have two a’s: 62 + 62
So this means out p is 0.75 and our q is 0.25. (Remember that p is the same as A and q is the same as a in our example here.)
Now we plug in p and q:
2pq = 2(0.75)(0.25) = 0.375
As the final step, we multiple 0.375 by the total population number, 1000 in this case. That gets us to 375.
Since this number matches the true number of AA’s, there are very few relatives having kids together in this population.
Read More:

Author: Dr. D. Barry Starr
Barry served as The Tech Geneticist from 2002-2018. He founded Ask-a-Geneticist, answered thousands of questions submitted by people from all around the world, and oversaw and edited all articles published during his tenure. AAG is part of the Stanford at The Tech program, which brings Stanford scientists to The Tech to answer questions for this site, as well as to run science activities with visitors at The Tech Interactive in downtown San Jose.