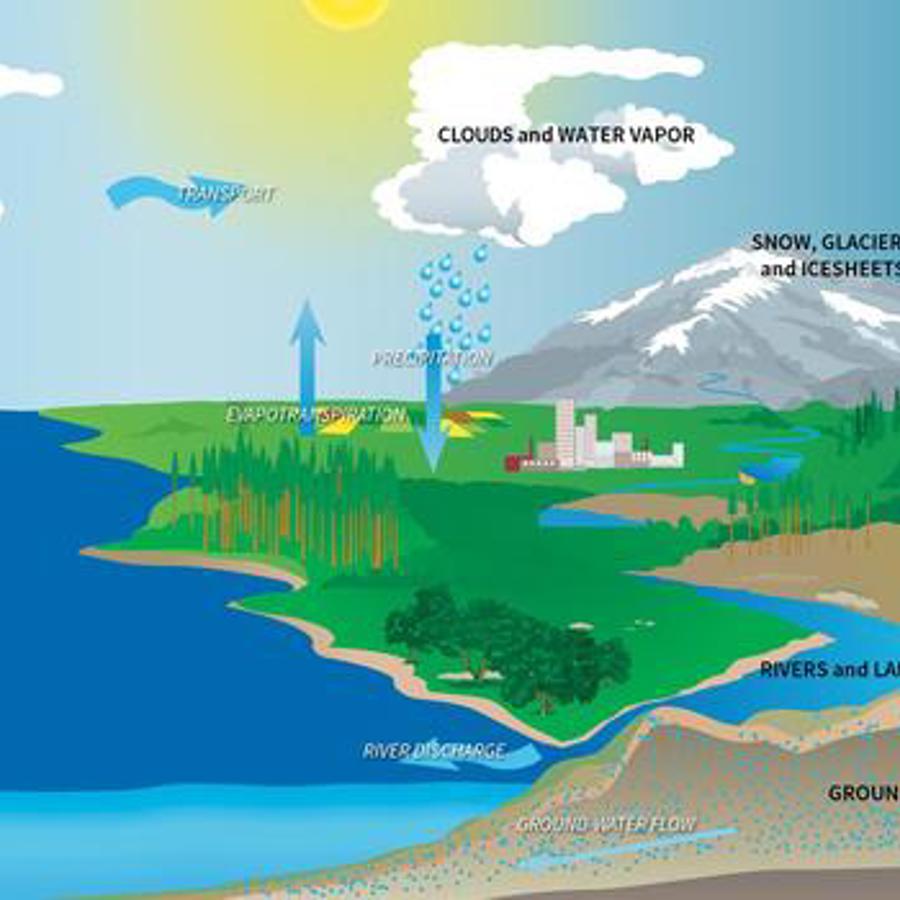
Precipitation Towers: Modeling Weather Data
Duration: 30-60 minutes
Grade Levels: K-5

This lesson uses stacking cubes as a way to graph precipitation data, comparing the precipitation averages and seasonal patterns for several locations. Variations on the lesson can accommodate various ages and ability levels.
Resources
Grade Levels: K-5
Duration: 30-60 minutes
Concepts/Skills: DATA COLLECTION, ANALYSIS AND PROBABILITY, EARTH, MEASUREMENT, NUMBER AND OPERATIONS, PHYSICAL SCIENCES, PROBLEM SOLVING,
REMOTE SENSING.
Climate Standards Connections
| Next Generation Science Standards | ||
| Grade | Performance Expectation | Description |
| K | K-ESS2-1 | Use and share observations of local weather conditions to describe patterns over time. |
| Climate Change Connections | temperature sun warming | |
| Clarification Statement & Assessment Boundary | Examples of qualitative observations could include descriptions of the weather (such as sunny, cloudy, rainy, and warm); examples of quantitative observations could include numbers of sunny, windy, and rainy days in a month. Examples of patterns could include that it is usually cooler in the morning than in the afternoon and the number of sunny days versus cloudy days in different months. Assessment of quantitative observations limited to whole numbers and relative measures such as warmer/cooler. | |
 Skip Navigation
