 Skip Navigation

How well can ancestry tests detect third or fifth cousins?
January 17, 2017
- Related Topics:
- Relatedness,
- Consumer genetic testing,
- Ancestry tests
A curious adult from British Columbia asks:
“How likely is a test from 23andMe or Ancestry.com to see if two people are third cousins? What about fifth cousins?”
Tests like those from 23andMe and Ancestry.com are incredibly good at detecting relationships between people. Even distant people like the 5th cousins have a pretty good shot at finding shared DNA, which ultimately came from their great-great-great-great grandparents.
Here is a useful table that breaks out the odds that two relatives will share DNA in one of these tests (along with how many of these relatives you have on average):
|
Relationship |
Expected number of cousins |
Chance you can detect shared DNA (Likelihood of IBD) |
|
1st cousins |
7.5 |
100% |
|
2nd cousins |
38 |
100% |
|
3rd cousins |
190 |
90% |
|
4th cousins |
940 |
46% |
|
5th cousins |
4,700 |
15% |
|
6th cousins |
23,000 |
4% |
|
7th cousins |
120,000 |
1% |
Table data from Henn et. al. Plos One. 2012.
In this table, “likelihood of IBD” is a scientifically precise way to say “chance of being able to see shared DNA.” This is the chance that the two people share at least some of the same DNA from those distant relatives.
As you can see, these tests are incredibly powerful even up to third cousins. Theoretically, you should see shared DNA in every first and second cousin, and 90% of third cousins. It goes down after this but you even have a pretty good chance of even detecting seventh cousins!
This is way more powerful than other relationship tests like “sibling DNA tests” or “cousin tests”, which are based on the same principles as a paternity test. These tests can’t give you a clear answer for anything besides a parent/child relationship. Heck, they have trouble with even siblings!
The table also gives you some idea about how many first, second and so on cousins you might expect to have. This is based on around 2-3 kids per generation and so doesn’t fit everyone’s situation but it does give you an idea about how the numbers increase. You probably have more than 100,000 seventh cousins for example.
What these tests are less precise about is the actual relationship. So sometimes the test will call someone as a third cousin when they may actually be a fifth cousin and so on. The more distant the relationship, the less precise the relationship assignment.
But these tests are still stronger than any others at telling if two people share DNA from distant relatives. They just don’t always get the exact relationship right.
Theory vs. Reality
Lots of people do simple math to figure out how related two people are. Using this system, you share 50% of your DNA with your parents, brothers and sisters; 25% with your grandparents, aunts, uncles, nieces and nephews; and so on.
These numbers get a little trickier with cousins. First cousins share 12.5%, second cousins 3.125%, third cousins 0.78125%, and so on. But in real life, these are averages. The exact numbers will vary, sometimes a lot.
Here is a great figure that gives you some idea about what the ranges are in actual life:
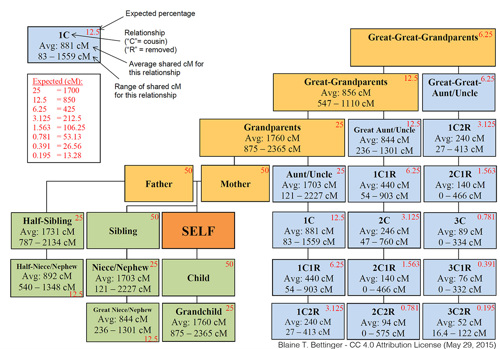
In this figure, the amount of shared DNA is expressed in something called centimorgans (cM). It isn’t important what those are (although click here if you are interested). The key thing to focus on is the potential overlaps.
Let’s take an example where you’d think the test could pretty easily tell two people apart—first and second cousins.
Remember, first cousins should share 12.5% of their DNA while second cousins should share 3.125%. You can see these numbers in red in the table (1C is first cousin, 2C is second cousin).
In terms of cM, first cousins share, on average, 881 cM, while second cousins share 246 cM. These numbers are in the same ballpark as the percentages—first cousins share around four times as much DNA.
But when we dig into the numbers, we can see a much wider range around those averages. So first cousins share as little as 83 cM and as much as 1559 cM.
And when we look at second cousins we see something similar. Here the range is 47-760 cM.
What this means is that anything between 83 and 760 cM could be either a first or second cousin. At the lower end second cousin is more likely and at the upper end first cousin but either is possible in these ranges.
In fact, have a quick look around just part of the chart to see how tricky it can be to tell a relationship just with DNA:
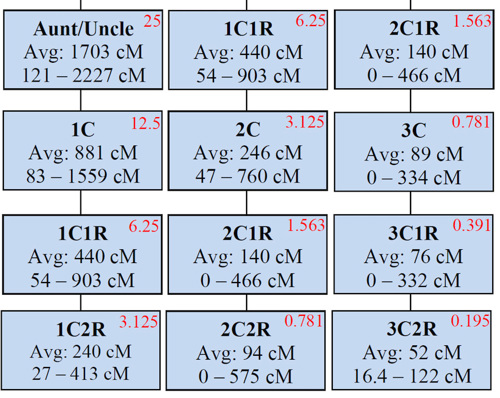
For first cousins, the higher number is pretty close to what you might expect for an uncle and a nephew and the lower number is more like a third cousin twice removed! This means that in extreme cases, first cousins might look like an aunt and her niece!
What this all means is that these tests are very good at telling if two people share DNA but are less good at identifying the relationship. For example, they will pretty much be able to tell that any pair of first cousins share DNA and therefore are related.
But because of those ranges of possible shared DNA, it isn’t nearly so easy to parse out the exact relationship. And this matters depending on the question you are asking.
That is where good old fashioned genealogy leg work comes in handy. With proof that two people share DNA, you can search through various databases to reconstruct the family tree that shows what the relationship actually is.
If you are interested in where these ranges come from, please see our previous answer here, where we go a bit deeper into the biology.

Author: Dr. D. Barry Starr
Barry served as The Tech Geneticist from 2002-2018. He founded Ask-a-Geneticist, answered thousands of questions submitted by people from all around the world, and oversaw and edited all articles published during his tenure. AAG is part of the Stanford at The Tech program, which brings Stanford scientists to The Tech to answer questions for this site, as well as to run science activities with visitors at The Tech Interactive in downtown San Jose.